
Enter all the desired criteria: the apps that satisfy them all will be searched; if a criterion is specified multiple times, only the last occurrence will be considered.
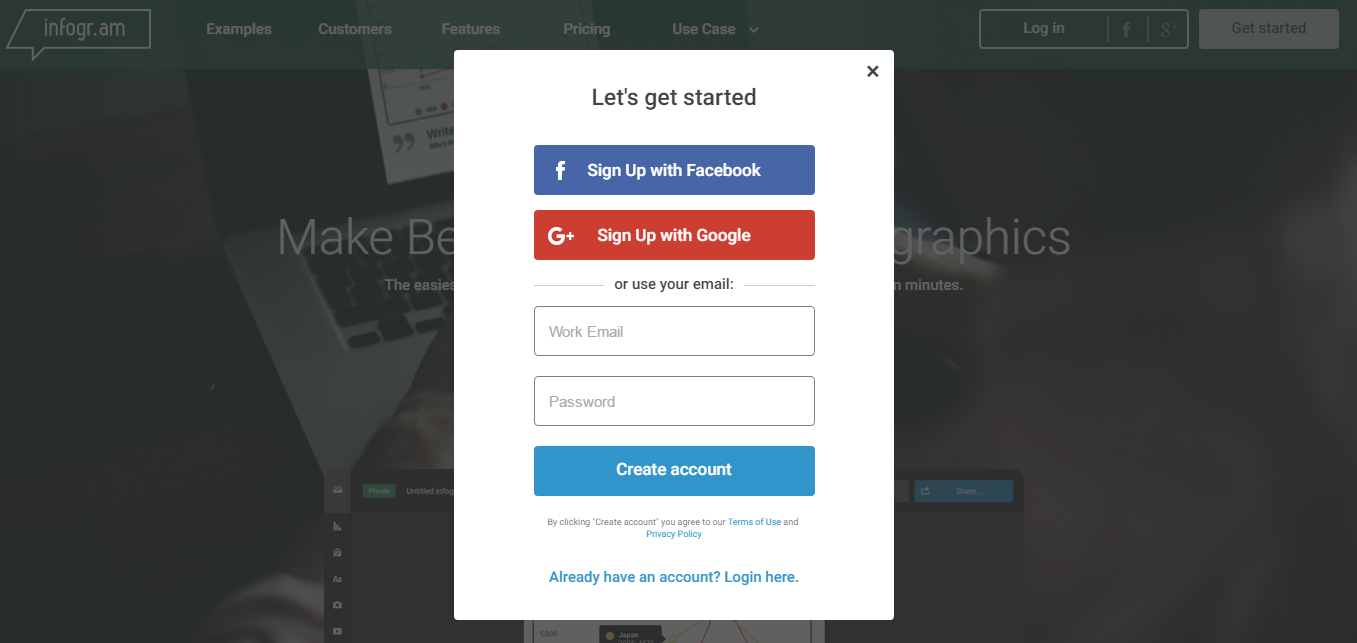 Once authenticated we find the dashboard where are visible our created products and decide the template of a new infographic, graph, geographical map or importing our data.
 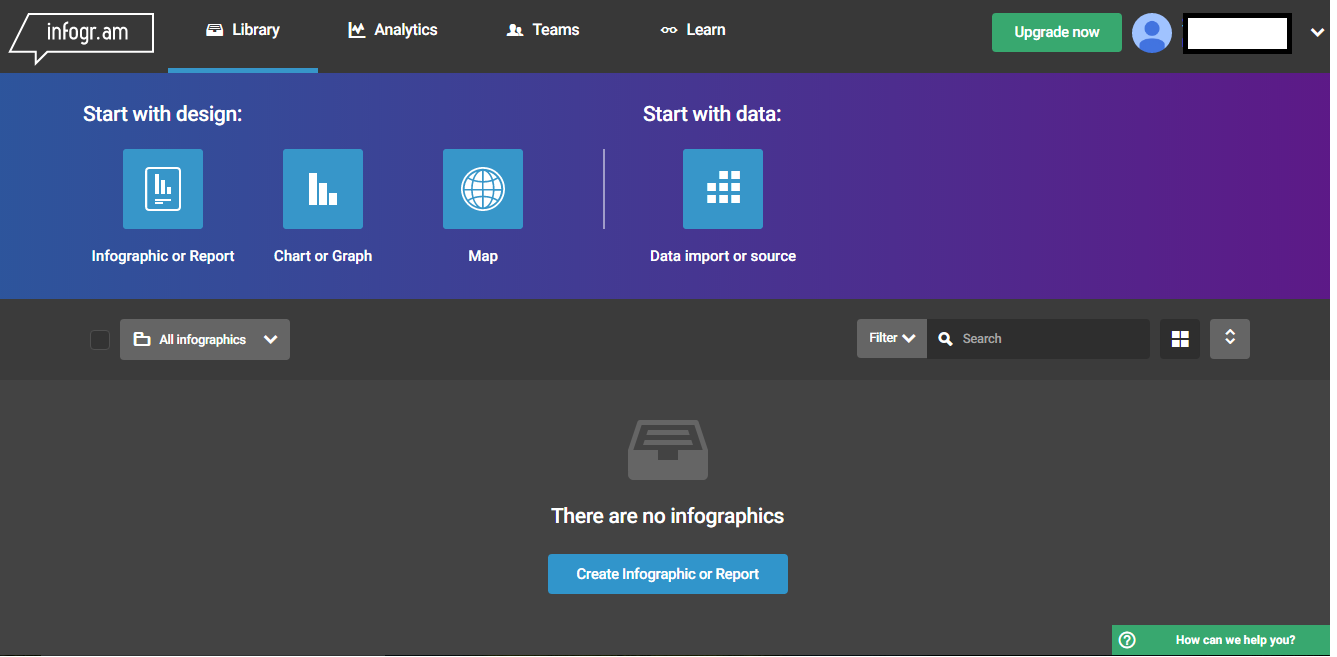 If you choose to start a new graph, Infogr.am shows a series of ready themes to choose from.
 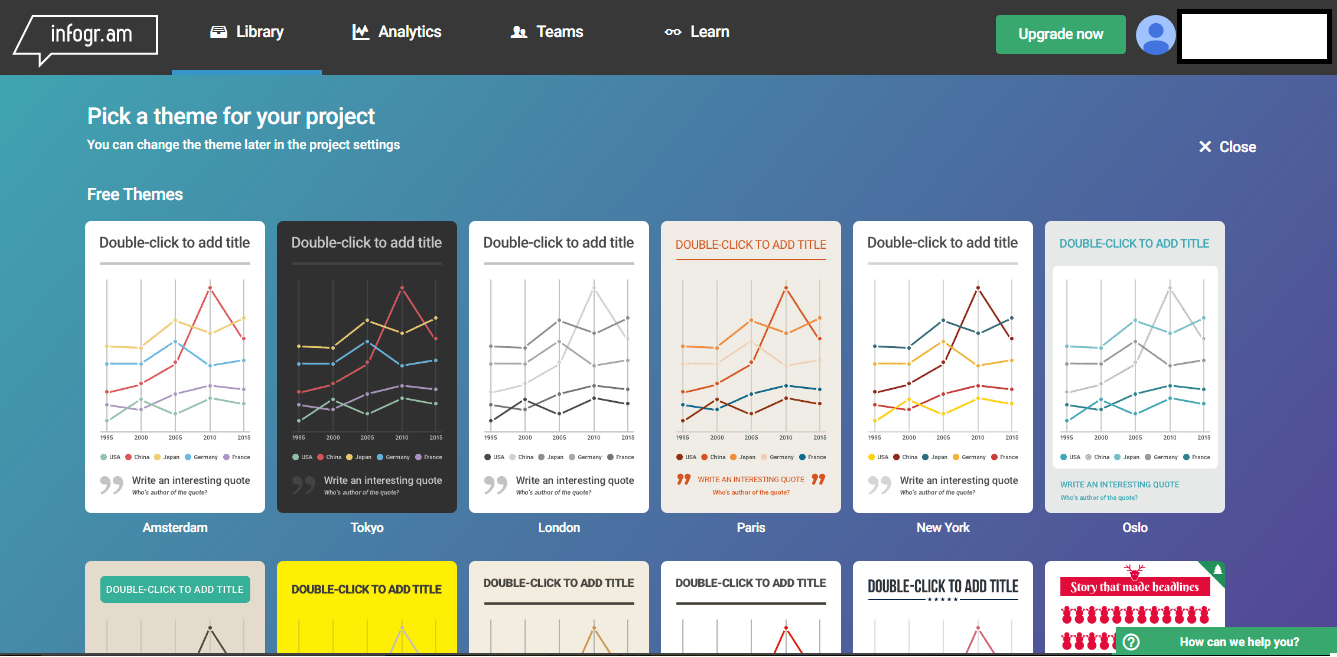 If we choose to start with data, in the next page we’ll be able to choose the source of the data document.
 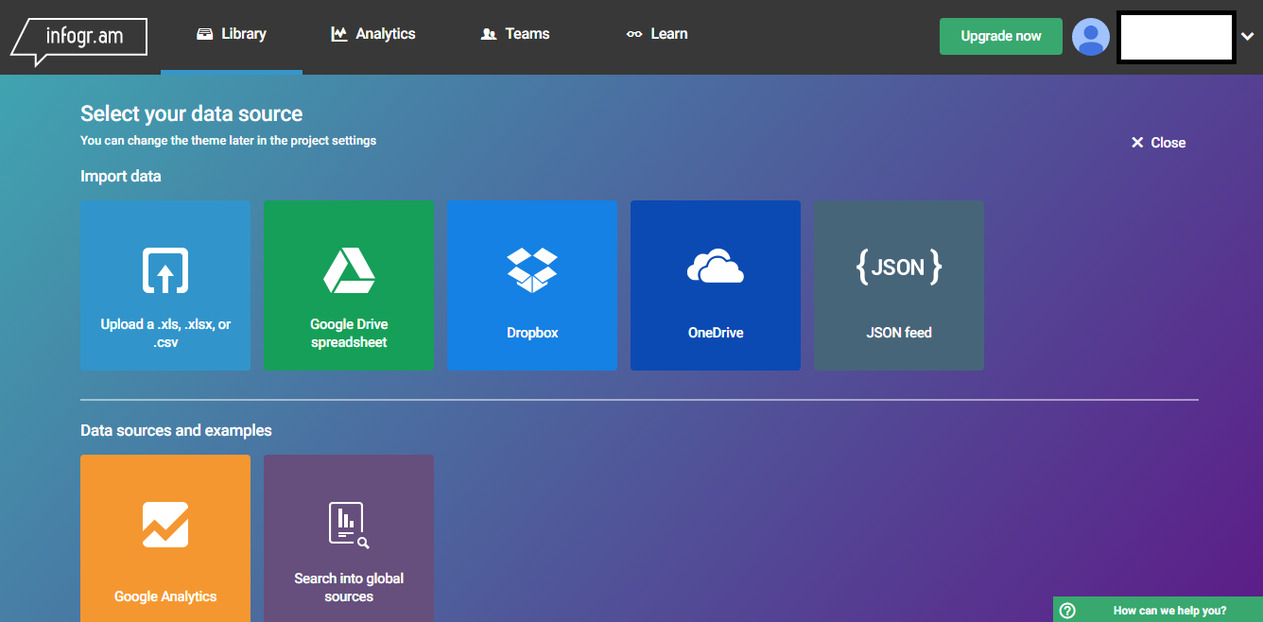 After that a new graph will appear and it’ll be possible to customize its aspect.
 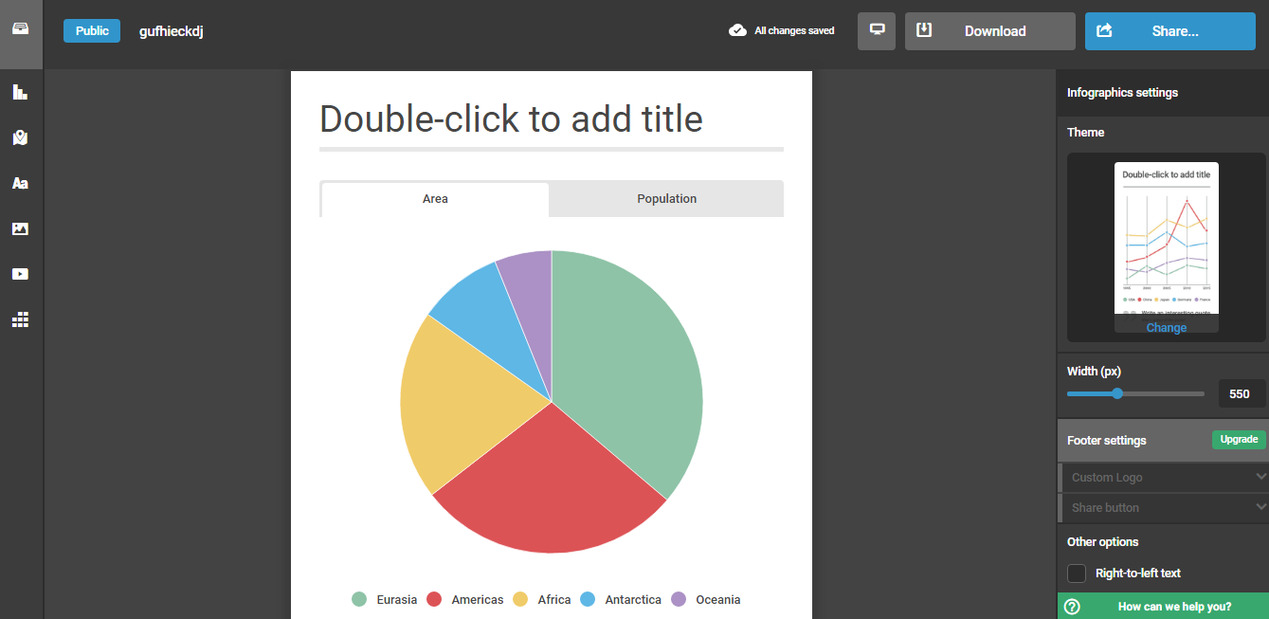 Through a double click it is possible to modify the associated data or inserting new ones.
 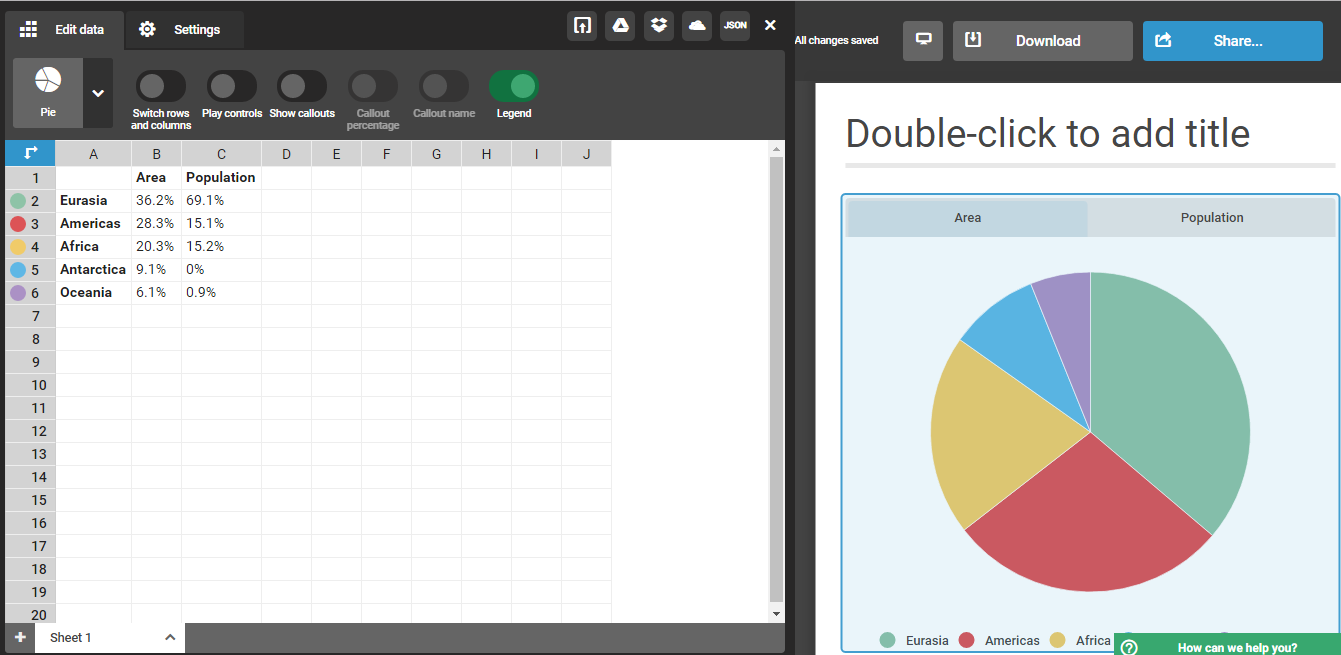 At the end of the editing phase it’ll be possible to assign a name to the graph before share it.
 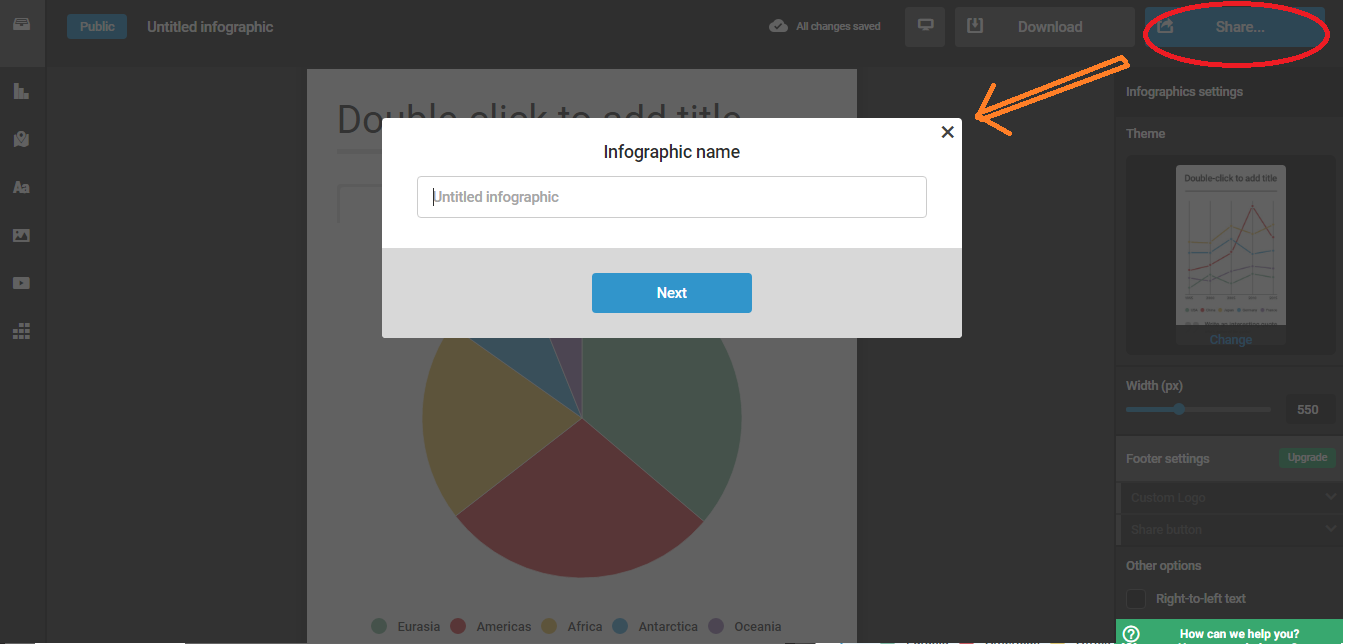 Now all is ready for the sharing on social platform, embed it in Web pages or distribute its url.
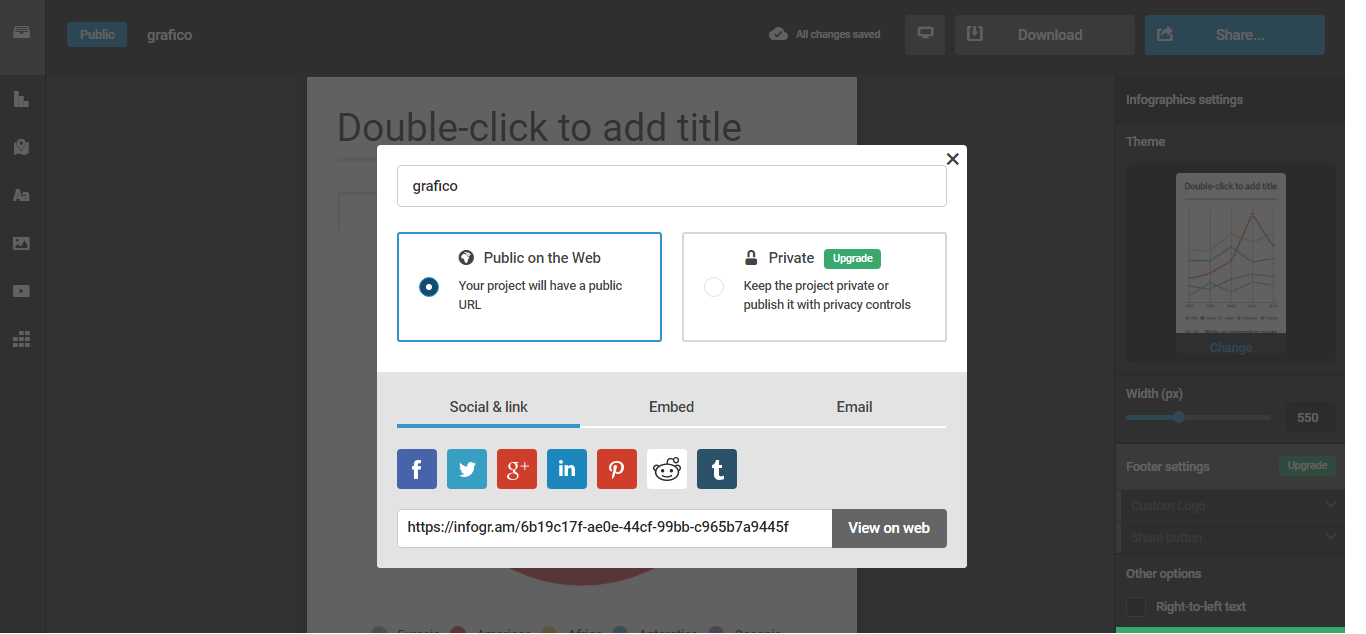


Copy link