
Enter all the desired criteria: the apps that satisfy them all will be searched; if a criterion is specified multiple times, only the last occurrence will be considered.
 The following is the Coggle’s dashboard. This is where the projects you have created appear, and in the menu on the left you can view the ones you have shared, explore the gallery, and organize your projects into folders. To create a new project just click on "create diagram”.
 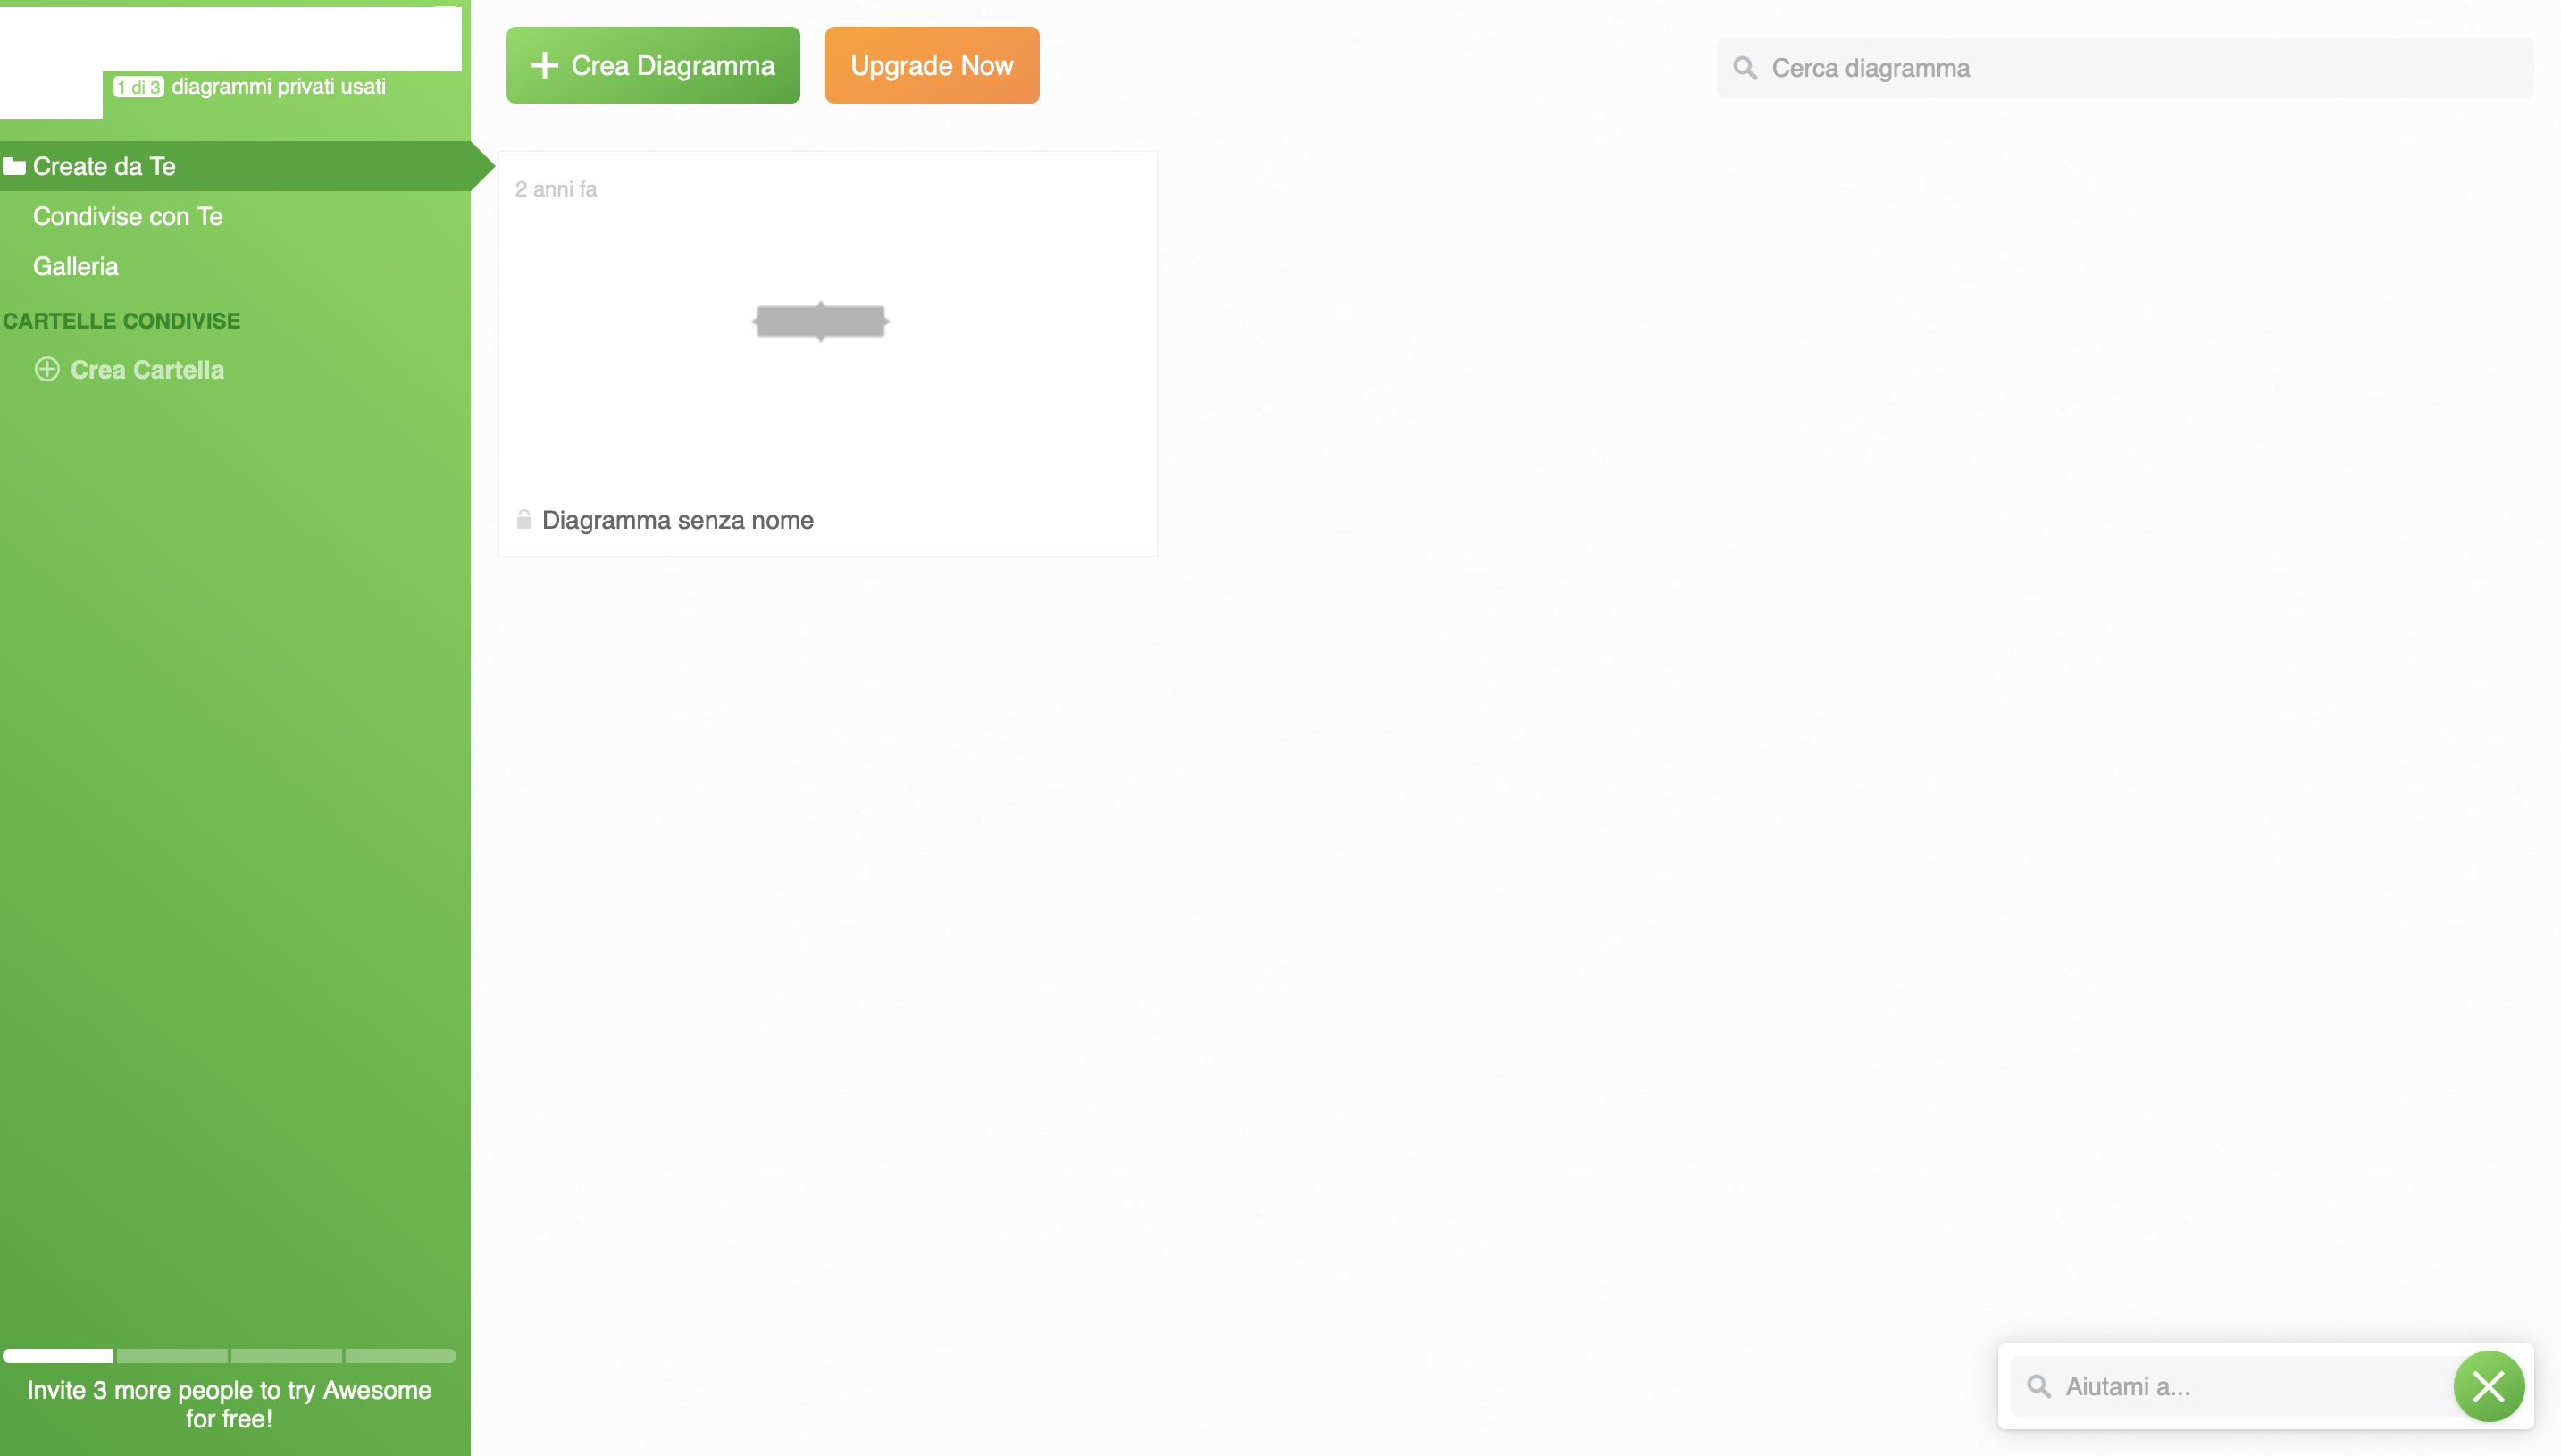 The following is the editing screen. A node appears on the screen to which you can add and link other nodes by clicking on the "+" on either side of it. To each node you can add text and format it to your liking, add a link, image or icon. Nodes can also be changed in size by dragging the corner of the area, and, in addition, you can change the color of the branches by double-clicking on them.
 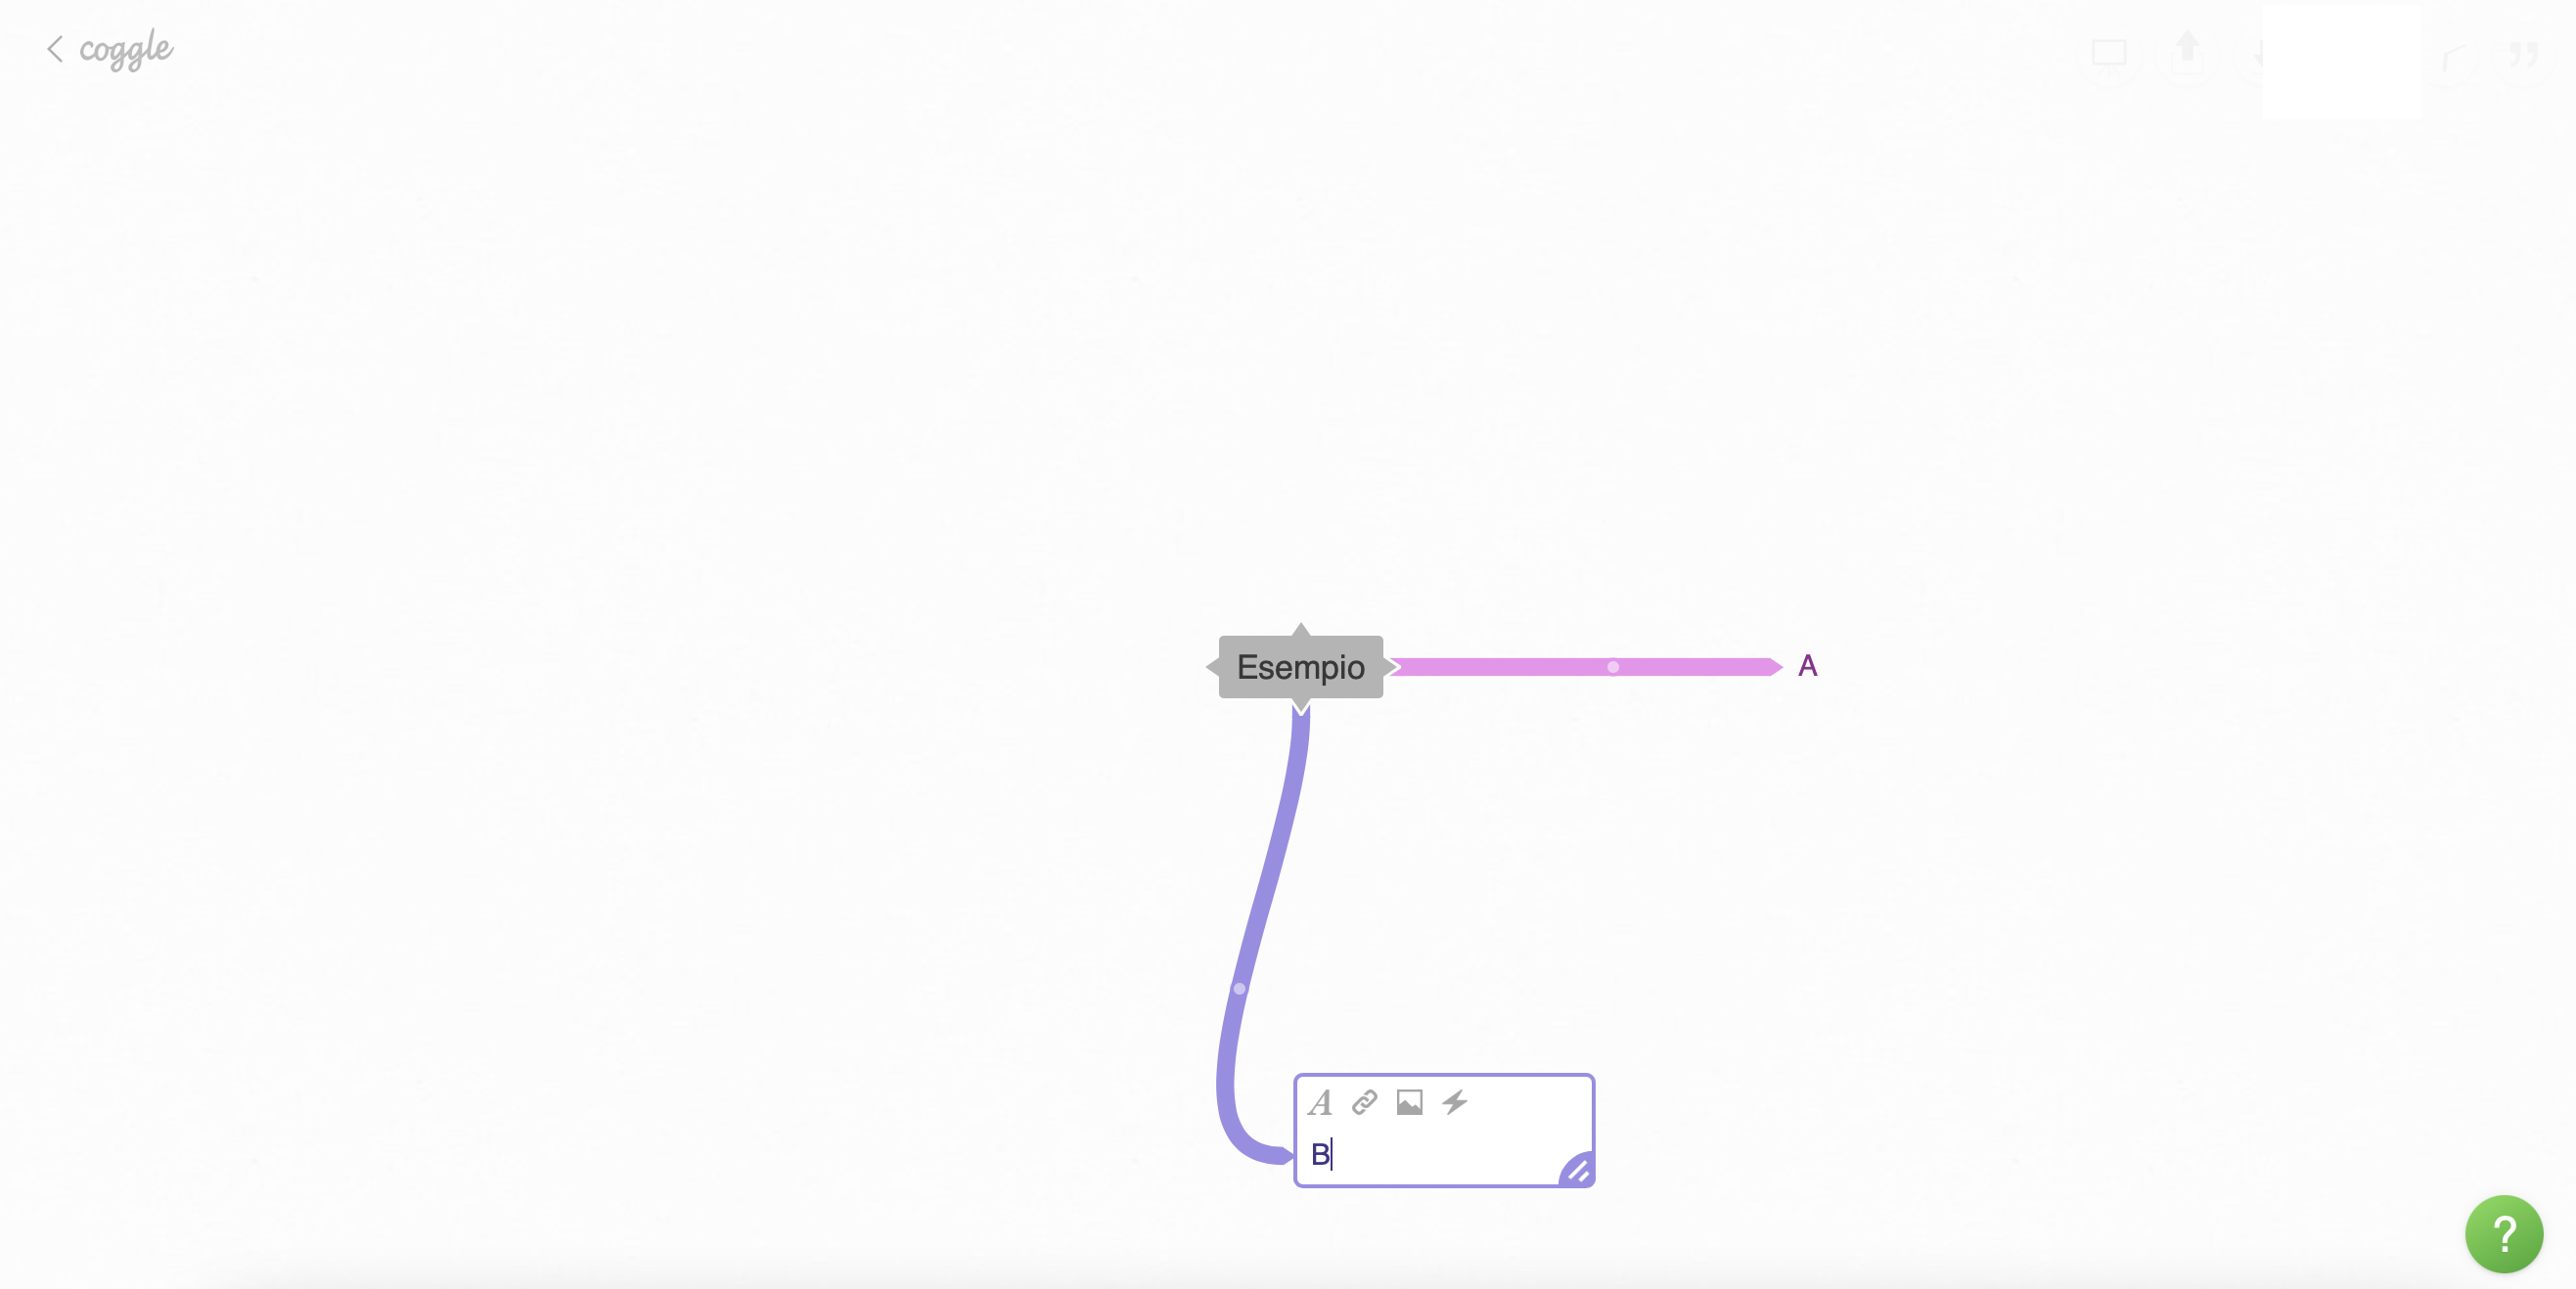 Holding down the left mouse button above a node will bring up a context menu for choosing which operation to perform, as in the figure below. In the top left menu you can start a presentation, share and download your project, invite other users to collaborate on your project, and use chat and comments to communicate with other collaborators.
 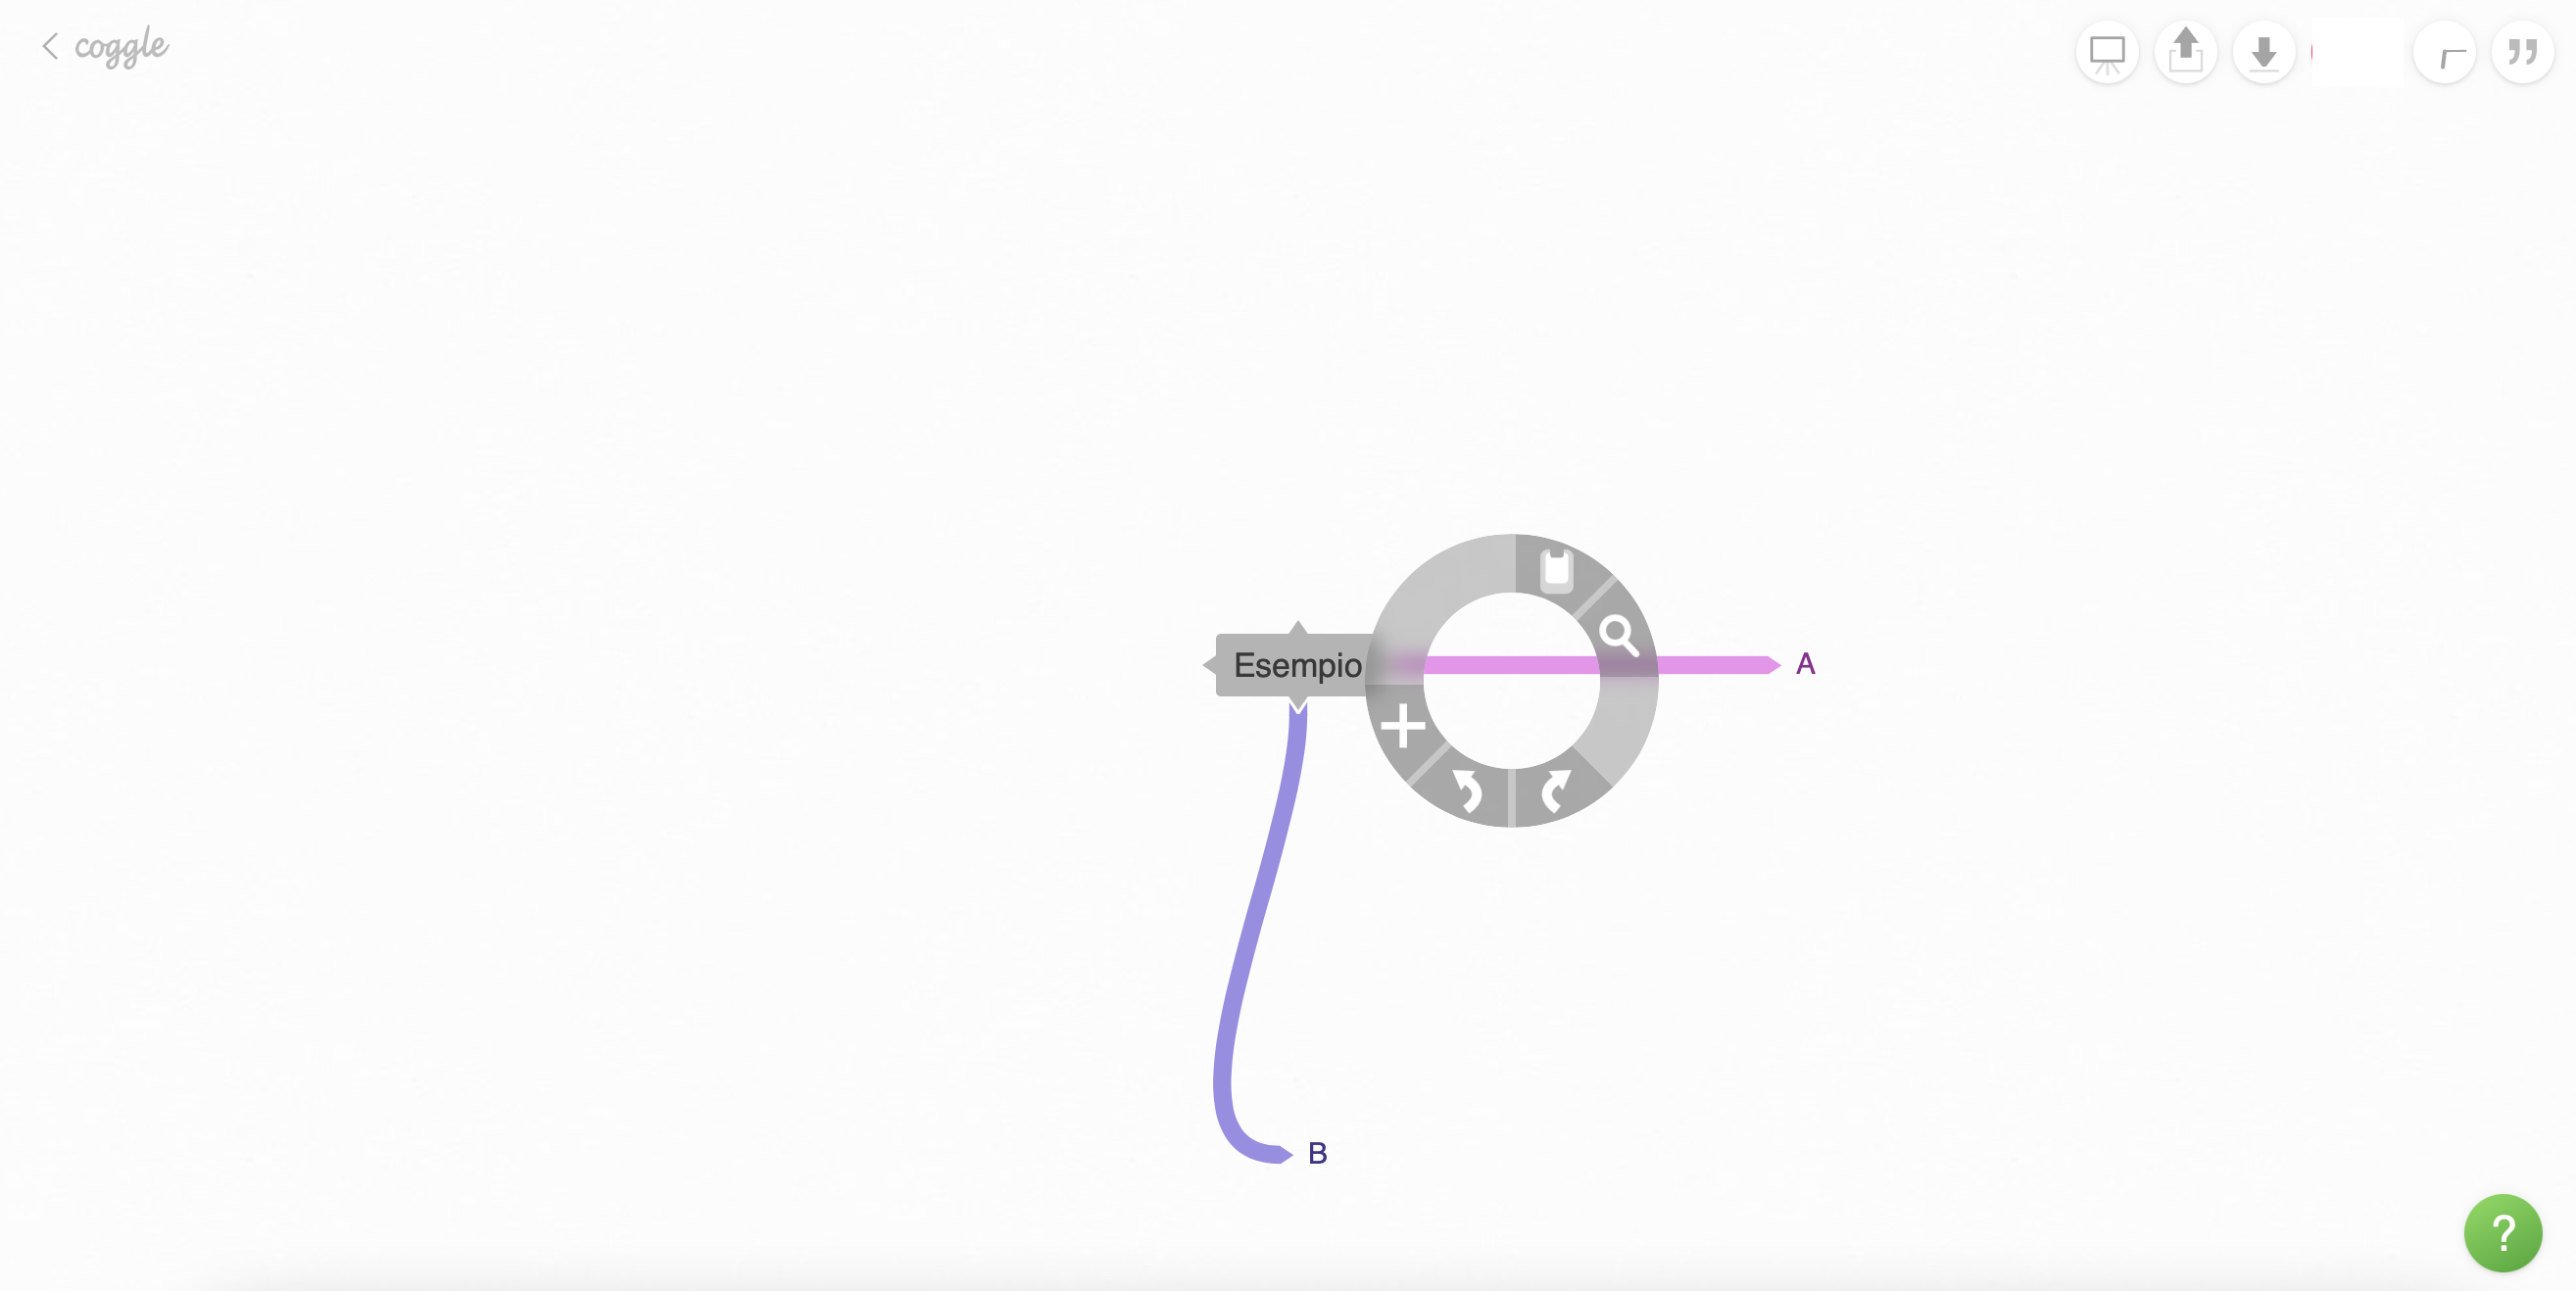 Here’s an example of a product made with Coggle. It’s a diagram about advertising efficiency. As you can see, the diagram is full of images and links.
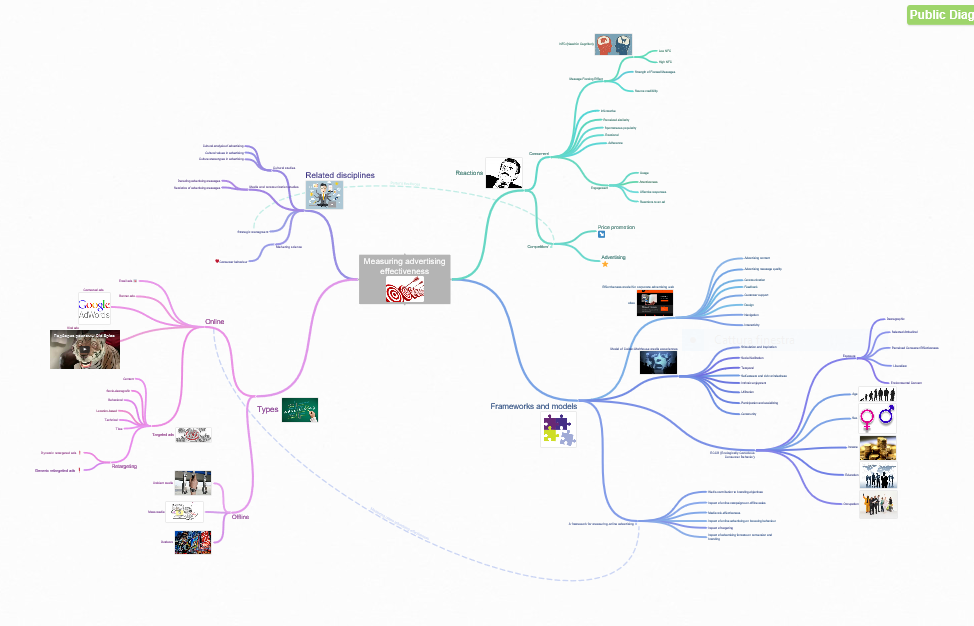


Copy link