
Enter all the desired criteria: the apps that satisfy them all will be searched; if a criterion is specified multiple times, only the last occurrence will be considered.
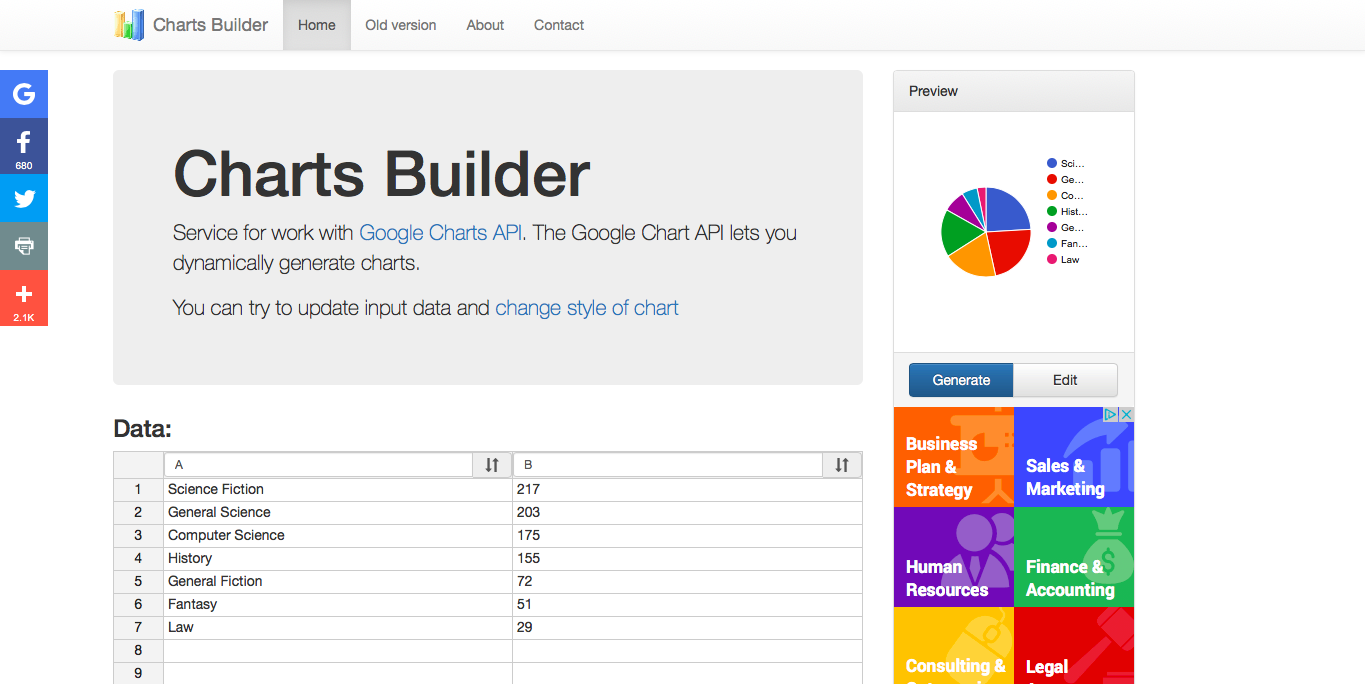 The homepage presents a graphic obtained from example data. The user has to select which parameters to modify and insert his own data. Once you insert the data you can choose the type of graphic, by clicking on “Edit” (below the preview). This is the page that will appear.
 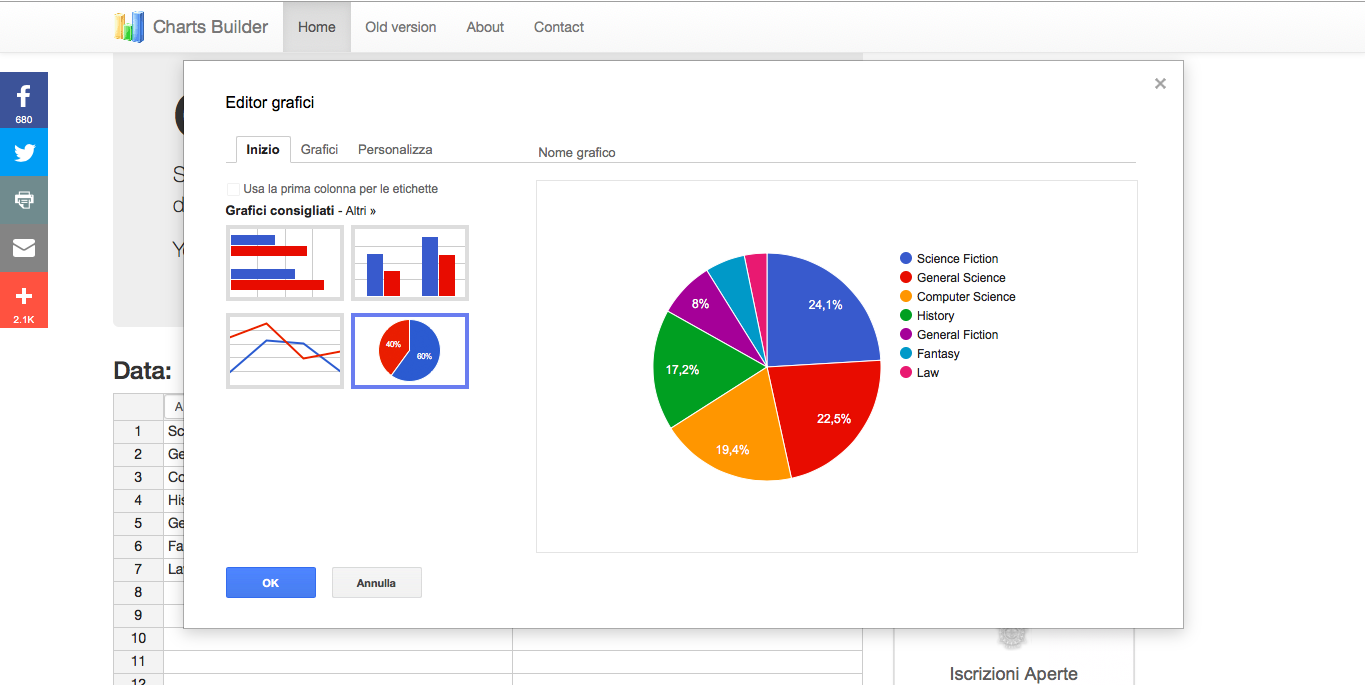 We can choose one of the suggested graphics or we can click on “graphics” and widen the choice.
 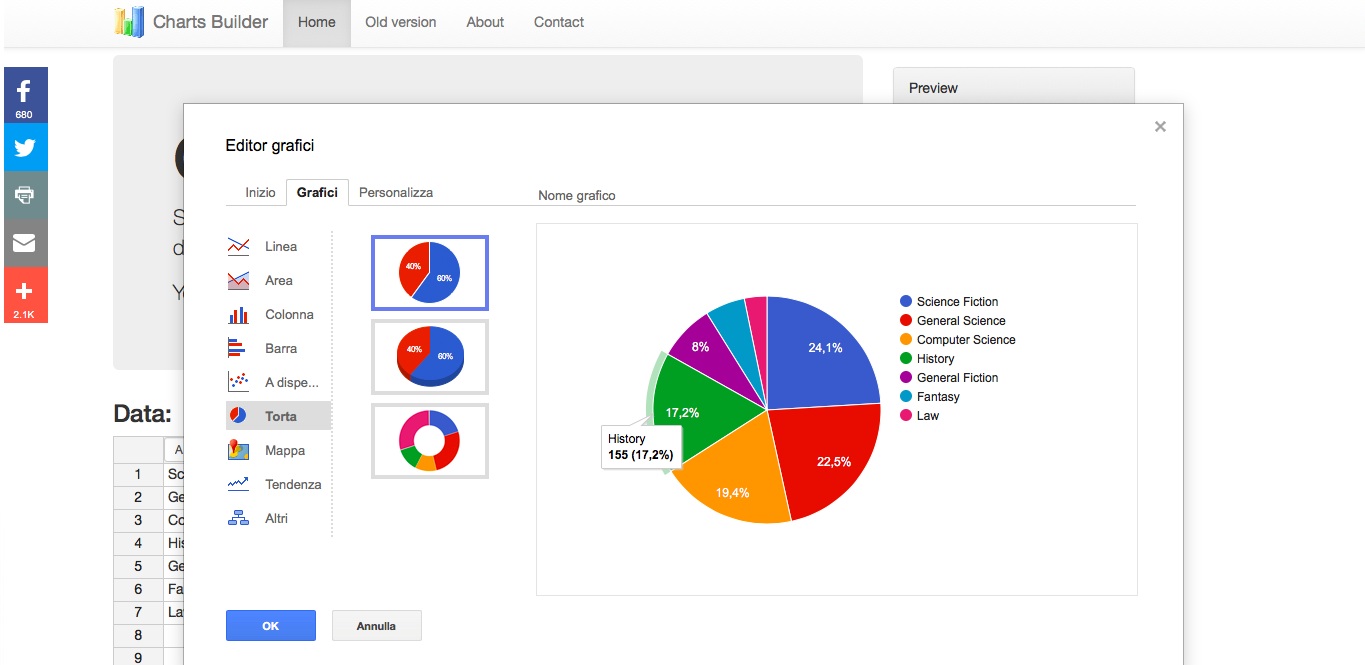 After choosing the graphic we prefer we pass on to the customization: we can for example give a title to our graphic, modify the arrangement of the legend, choose the background color, etcetera.
 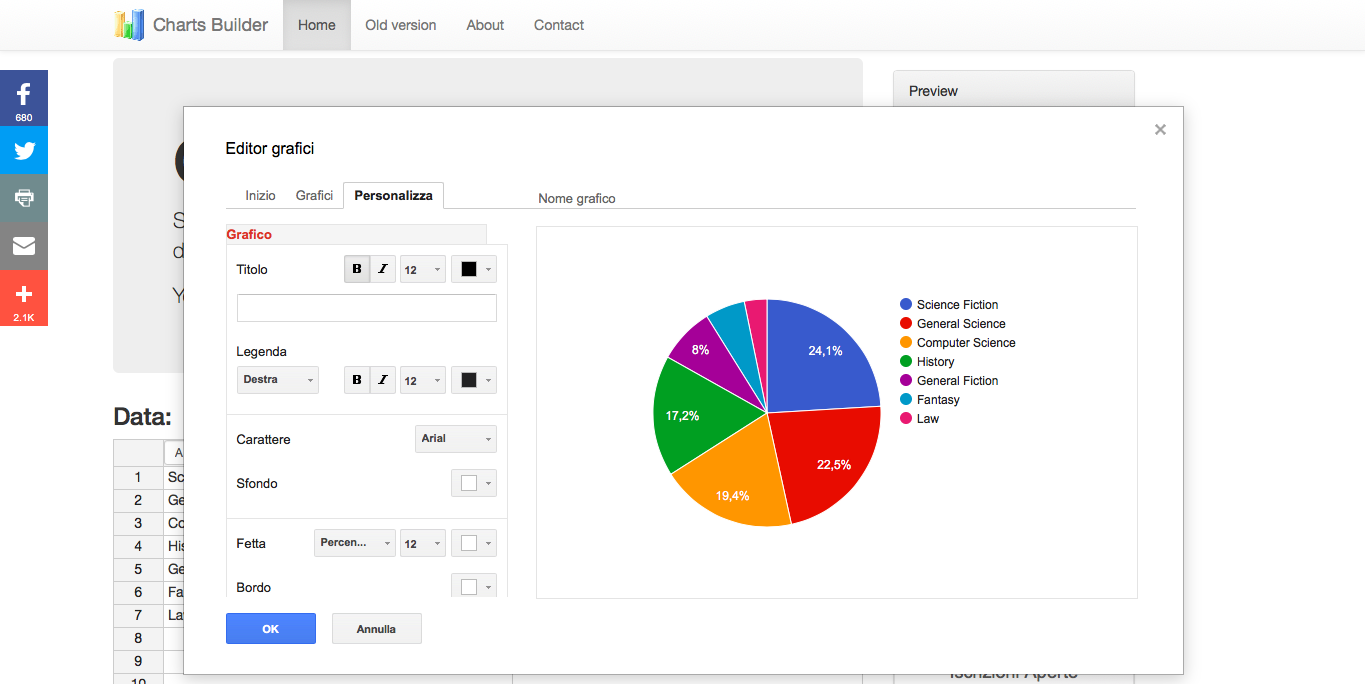 At the end of the customization we have completed our graphic and we will be able to click on “Generate” (below the preview of the graphic); the page that will be opened is the following one.
 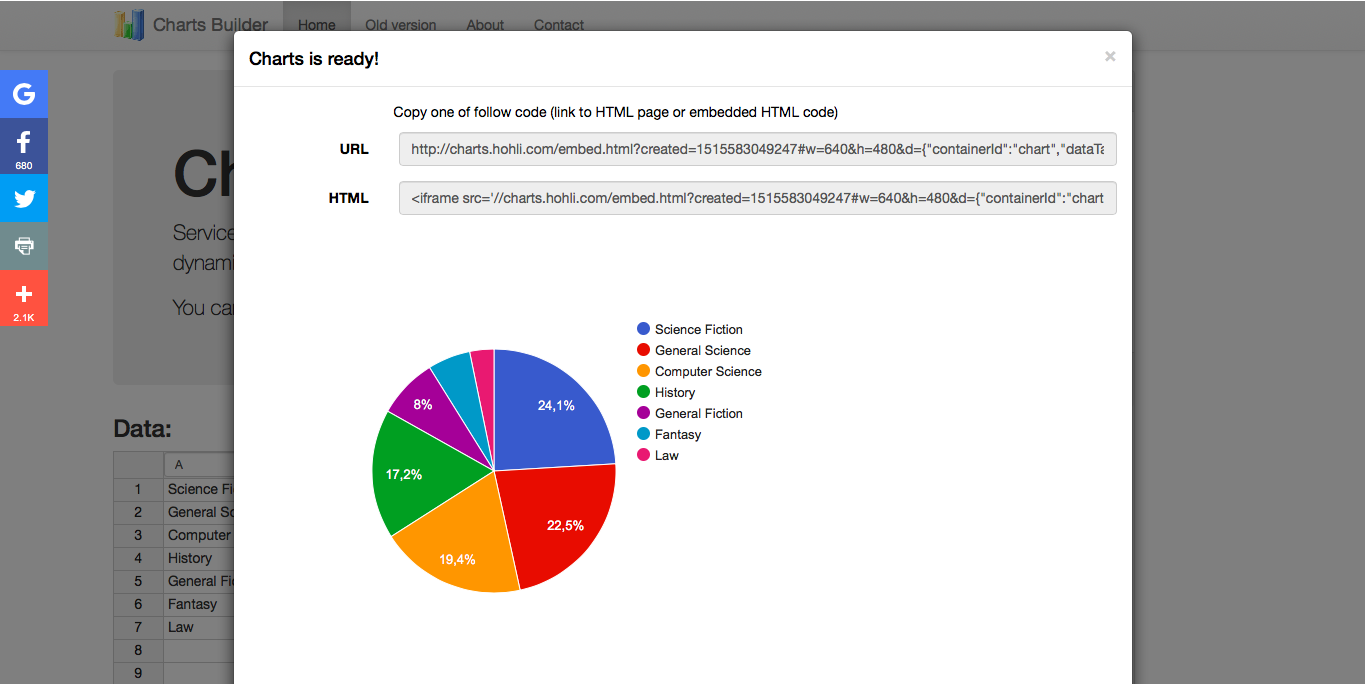 We can share it with our friends and colleagues by clicking on the items on the left: Google, Facebook, Twitter, Print, Share On, give out the provided url or use the embed code.
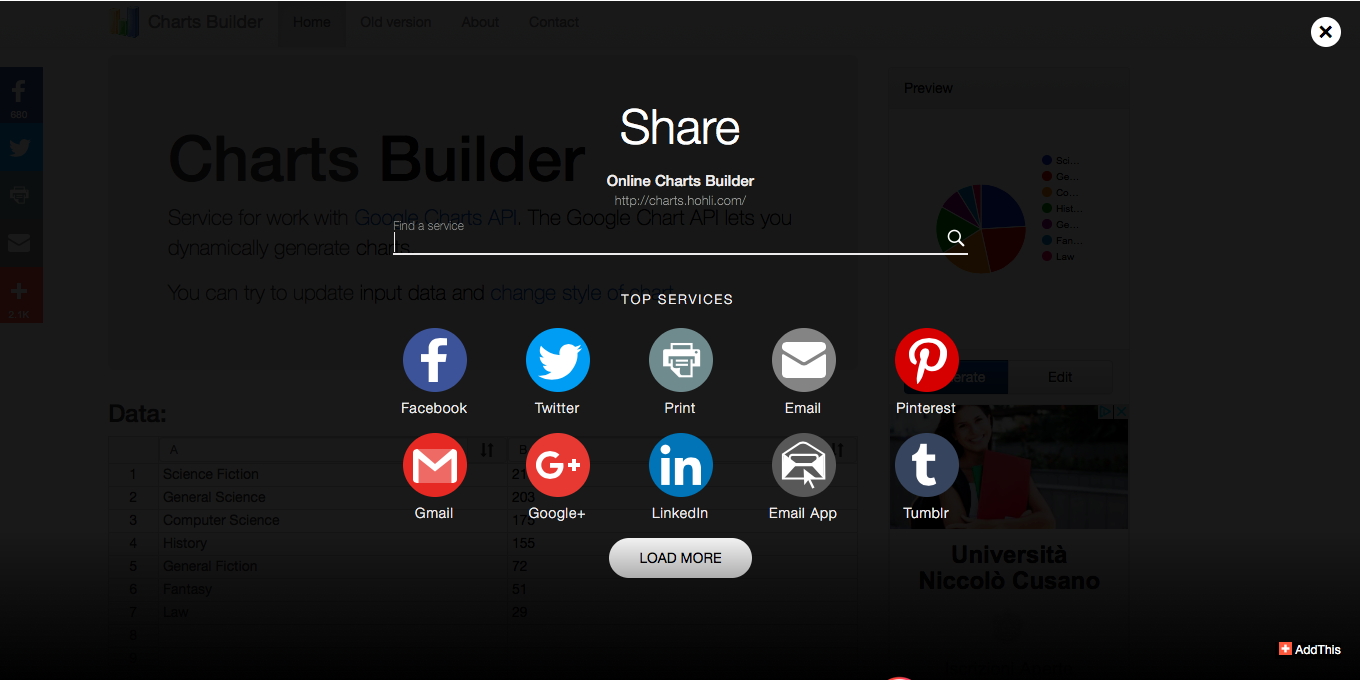


Copy link